
User Tools
Sidebar
bwm-realtime
This is an old revision of the document!
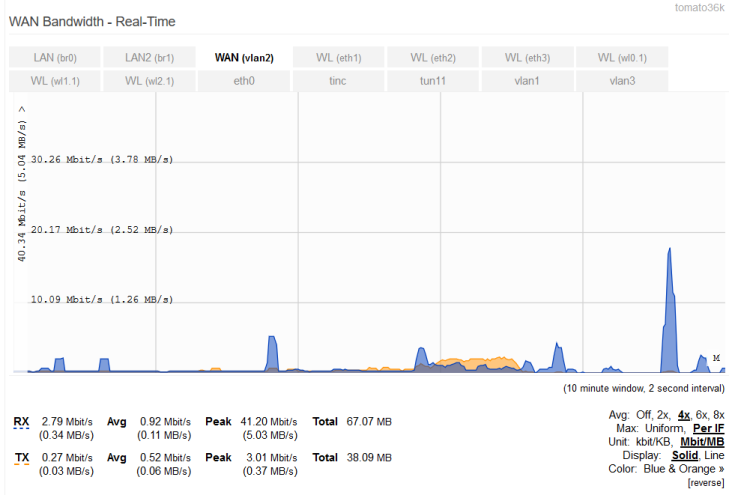
Bandwidth - Real-Time
The Bandwidth - Real-Time menu provides live monitoring of any router interface in graph form. Data are reset when the page first loads1), and the display draws gradually.
The maximum display window is 10 minutes, and data resolution is 2 seconds. That means 10 minutes of data can be displayed at a time, and that data can be sampled at most, every 2 seconds. Only one interface at at a time can be displayed. Clicking on the interface name in any square displays the bandwidth of that interface.
The interfaces available to be monitored will depend on your router hardware and configuration (for example, using a VPN or virtual wireless interface).
Some possible FreshTomato interfaces are (depending on firmware release and mode):
- *vlan2: The wired WAN port on the router *vlan1: The wired LAN ports on the router *eth0: All Ethernet ports on the router *eth1: The Wireless 2.4 GHz radio *eth2: The wireless 5 GHz (if equipped) radio *br0: The software bridge corresponding to vlan1, eth1, eth2. (or “The LAN”)
Avg. applies a percentile to the image. This shows how a data point compares to the total distribution over time. Max: *Uniform - scales graphs to the maximum value recorded on all interfaces. *Per If (Per Interface) - scales graphs based on data from one interface only. Unit: *kbit/KB - toggles between displaying volume in kilobits/Kilobytes (1,000). *Mbit/MB - toggles the display to volume expressed in megabits/Megabytes (1,000,000). Display: *Solid - graphs bandwidth usage with a solid area. *Line - graphs bandwidth using a single line representing maximum values. Color: switches between various pre-specified color schemes for the graph. [reverse]** : reverses the graph's color scheme. So, a device traced in blue is traced in orange and vice versa.

Cursor-Tracking Readout: Bandwidth graphs have a a Cursor-Tracking Readout. Moving your mouse cursor over the graph with cause the graph to display the following at the top right:
- Day of the Week
- Time
- Bandwidth usage.
These update as you move your mouse.
The Cursor-Tracking Readout disappears after 5 intervals: that is, 10 seconds in Real-Time, 10 minutes in Last 24 Hours, and so on.
Mouse-Click Readout: Bandwidth graphs also feature a Mouse-Click Readout: If you click on the graph, the date/time/bandwidth numbers will display beside the mouse cursor.
The Mouse-click readout is static. It does not update with graph movement or scaling.
1)
Although there is not data to “reset” when page first loads, it is reset on each subsequent [re]loads
bwm-realtime.1715047958.txt.gz · Last modified: by hogwild