User Tools
Sidebar
This is an old revision of the document!
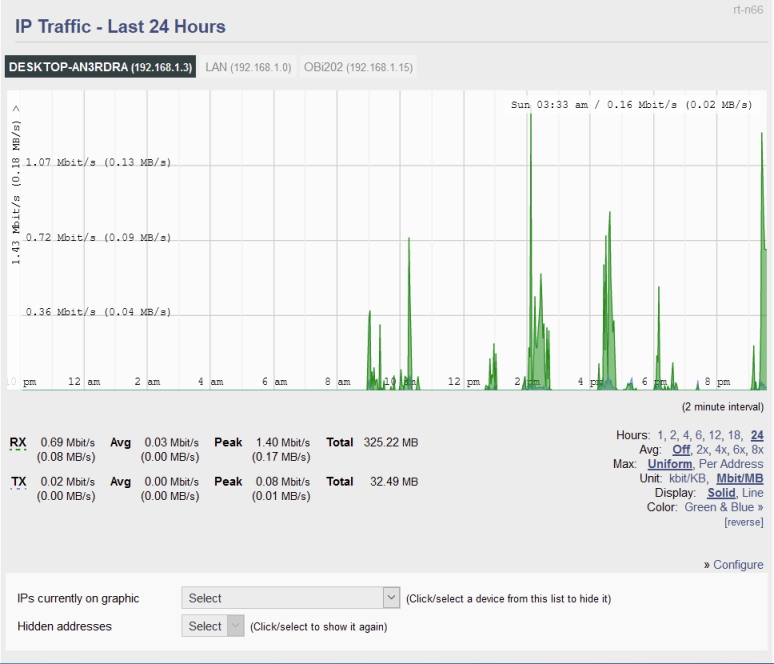
Last 24 Hours
The IP Traffic/Last 24 Hours page displays bandwidth used on selected network IP addresses/ranges during the last 24 hours. It does not collect all bandwidth usage based on a specific FreshTomato interface. That is the purpose of the Bandwidth/Last 24 Hours function.
IPs currently on graphic: allows you to select from which IP addresses/ranges you want to display bandwidth data.
Hidden Addresses: On this menu, you can select IP addresses whose bandwidth is currently not being displayed on the graph to be measured/graphed.
The graph has a 24 hour window with a 2-minute interval. That means a maximum of 24 hours of bandwidth data are displayed, which are refreshed a maximum of every 2 minutes.
RX numbers show incoming bandwidth (to the LAN).
TX numbers show outgoing bandwidth (to the WAN).
Configure: Clicking on this button will take you to the Administration/Bandwidth Monitor page. There, you can enable and disable bandwidth monitoring, and configure settings bandwidth monitoring settings.
Avg. This applies a percentile to the image. This shows how a data point compares to the total distribution over time.
Max:
- Uniform - Choosing this scales graphs to the maximum value recorded on all interfaces.
- Per If (Per Interface) - Choosing this scales graphs based on data from one interface only.
Unit:
- kbit/KB - This toggles between displaying volume in kilobits/Kilobytes (1,000).
- Mbit/MB:This toggles the display to volume to be expressed in megabits/Megabytes (1,000,000).
Display:
- Solid - Choosing this option graphs bandwidth usage with a solid area.
- Line - Choosing this option graphs bandwidth using a single line representing maximum values.
Color: Thus switches between various pre-specified color schemes for the graph.
[reverse] : This reverses the graph's color scheme. For example, a device traced in blue is traced in orange and vice versa.

Cursor-Tracking Readout: Bandwidth graphs feature a a Cursor-Tracking Readout. When you move your mouse cursor over the graph, the graph displays the following at the top right corner:
- Day of Week
- Time
- Bandwidth usage.
These update as you move your mouse.
The Cursor-Tracking Readout disappears after 5 intervals: that is, 10 seconds in Real-Time, 10 minutes in Last 24 Hours, and so on.
Mouse-Click Readout: Bandwidth graphs also feature a Mouse-Click Readout: If you click on the graph, the date/time/bandwidth numbers will display beside the mouse cursor.
Note: Mouse-click readout is static. It does not update with graph movement or scaling.

